Draining the Lifeblood of the Economy: The Small Business Sector
Investors use various analogies to describe the importance of small businesses in the domestic economy. Some refer to the small business sector as the backbone or the lifeblood of the economy. At this current stage of the cycle, we could say there are rising risks of an acute backache or a draining of that lifeblood. In this edition of the Weekly Market Commentary, we discuss the weakness in small businesses and what that foreshadows in the markets and the economy.
Overview
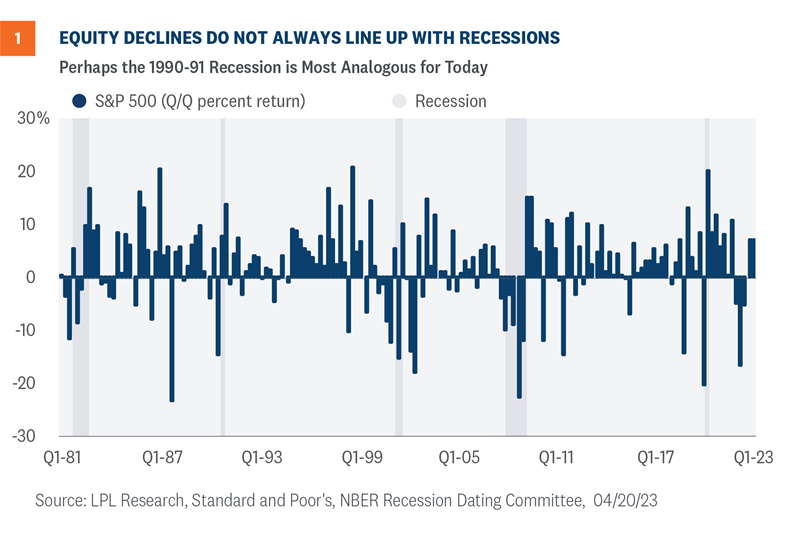
As we progress through 2023, investors have at least two corresponding questions: when will a recession start and will the markets retest their lows? If we are to develop a cogent answer, we must remember the relationship between equity markets and recessions is not always consistent.
In some periods, quarterly equity returns hit near-term lows during recessions, but not for the early 1990s, as shown in Figure 1. In fact, the S&P 500 fell over 14% quarter over quarter in the third quarter of 1990 as the business cycle reached a peak. And in the following two quarters during the recession, the S&P 500 rose roughly 8% and 14%—more than enough to recover losses incurred earlier in 1990.

Short and Shallow
Our base case is the U.S. economy will likely hit a short and shallow recession sometime late this year, with a potential of that negative shock pushed out into the beginning of next year. Current indicators suggest the recession will come sooner rather than later. The Conference Board’s March Leading Economic Indicators (LEI) fell to levels last seen in November 2020 when the economy was reeling from a global pandemic. Markets shrugged off the decline in the March index since investors already knew the weakness in the 10 underlying components. Historically, an economic contraction has closely followed a decline in the LEI of this magnitude. A recession may be all but certain, so the more important question is if markets will hit new lows as the economy contracts. We think not.
The head fake from last year’s two quarters of negative economic growth and the uncertainty from an aggressive Fed were primary culprits for pushing down the markets last year. Although 2023 has its fair share of risks, we do not think markets will retest last year’s lows, despite the likelihood of a recession later this year. Perhaps the relationship between the equity markets and the 1990-91 recession is most informative for today’s most likely scenario.
Watch Small Businesses for Leading Indicators
Small businesses are often considered the backbone of the economy because of the amount of economic activity generated by the sector, and it looks like a backache has emerged. Pay careful attention to surveys from the National Federation of Independent Businesses (NFIB) for leading insights in the direction of the U.S. economy.
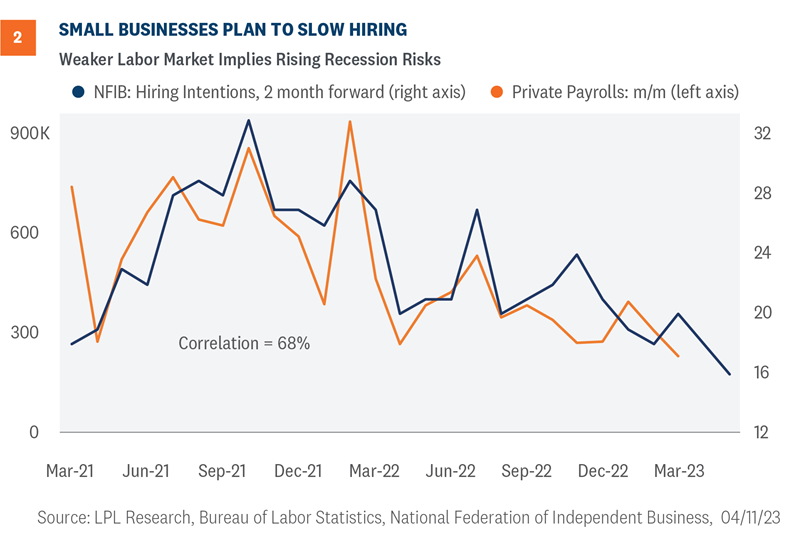
As shown in Figure 2, hiring intentions among small businesses declined in March, implying that upcoming job reports will likely be lackluster. Small businesses have an incredible impact on both the national and local economy. Small businesses make up the majority of all businesses by count, while also employing over 46% of the private sector workforce.1 It’s not a stretch to say “as goes the small and independent business, so goes the national economy.”

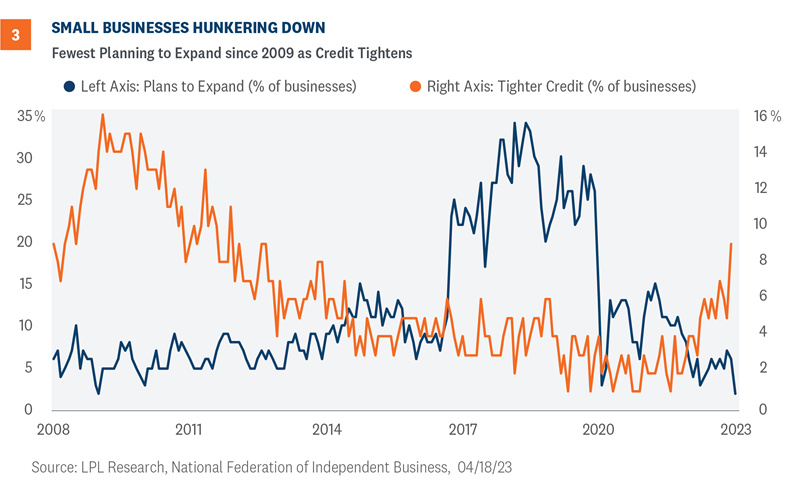
We know small businesses are especially concerned about a potential credit crunch. As shown in Figure 3, firms are hunkering down as few have expansionary plans in the near future. In fact, the number of firms reporting any expansion plans is the lowest since early 2009 when the economy was in the depths of the Great Financial Crisis. No doubt, tighter credit conditions impacted those decisions. The percent of small businesses reporting tighter credit is the highest since 2012, as lending institutions tighten up under the uncertainty of the macro landscape and following mid-March banking turmoil.

Summary and Investment Outlook
Businesses appeared to hunker down under the weight of tighter credit conditions and weaker economic growth. If small businesses are an accurate barometer, recession risks are rising and the labor market will likely cool in the coming months. Although the economy is slowing, the Fed continues its fight with inflation and will likely hike rates at the next meeting on May 2-3. However, if the economy becomes more unstable, inflation continues to decelerate, and the job market loosens, the Fed could pivot to rate cuts by the end of the year.
LPL Research remains comfortable with its year-end S&P 500 fair value target of 4,300–4,400. While that target was set based on a price-to-earnings ratio (P/E) of 18 and a 2024 EPS estimate of $240, the P/E may be a bit higher and the earnings number a bit lower when all the results are in. That said, the start of first quarter earnings season has been encouraging.
The LPL Research Strategic and Tactical Asset Allocation Committee (STAAC) recommends a modest overweight allocation to equities, with a slight preference for value over growth. Consistent with increasingly cautious signals from small businesses, the Committee has reduced its small cap allocation to benchmark levels. The Committee’s top sector pick remains industrials.
Within fixed income, the Committee recommends an up-in-quality approach with a benchmark weight to duration. We think core bond sectors (U.S. Treasuries, Agency mortgage-backed securities (MBS), and short-maturity investment grade corporates) are currently more attractive than plus sectors (high-yield bonds and non-U.S. sectors) with the exception of preferred securities, which look attractive after having recently sold off due to the banking stresses.
Jeffrey Roach, PhD, Chief Economist
Jeffrey Buchbinder, CFA, Chief Equity Strategist
IMPORTANT DISCLOSURES
This material is for general information only and is not intended to provide specific advice or recommendations for any individual. There is no assurance that the views or strategies discussed are suitable for all investors or will yield positive outcomes. Investing involves risks including possible loss of principal. Any economic forecasts set forth may not develop as predicted and are subject to change.
References to markets, asset classes, and sectors are generally regarding the corresponding market index. Indexes are unmanaged statistical composites and cannot be invested into directly. Index performance is not indicative of the performance of any investment and do not reflect fees, expenses, or sales charges. All performance referenced is historical and is no guarantee of future results.
Any company names noted herein are for educational purposes only and not an indication of trading intent or a solicitation of their products or services. LPL Financial doesn’t provide research on individual equities.
All information is believed to be from reliable sources; however, LPL Financial makes no representation as to its completeness or accuracy.
US Treasuries may be considered “safe haven” investments but do carry some degree of risk including interest rate, credit, and market risk. Bonds are subject to market and interest rate risk if sold prior to maturity. Bond values will decline as interest rates rise and bonds are subject to availability and change in price.
The Standard & Poor’s 500 Index (S&P500) is a capitalization-weighted index of 500 stocks designed to measure performance of the broad domestic economy through changes in the aggregate market value of 500 stocks representing all major industries.
The PE ratio (price-to-earnings ratio) is a measure of the price paid for a share relative to the annual net income or profit earned by the firm per share. It is a financial ratio used for valuation: a higher PE ratio means that investors are paying more for each unit of net income, so the stock is more expensive compared to one with lower PE ratio.
Earnings per share (EPS) is the portion of a company’s profit allocated to each outstanding share of common stock. EPS serves as an indicator of a company’s profitability. Earnings per share is generally considered to be the single most important variable in determining a share’s price. It is also a major component used to calculate the price-to-earnings valuation ratio.
All index data from FactSet.
There is no guarantee that a diversified portfolio will enhance overall returns or outperform a non-diversified portfolio. Diversification does not protect against market risk.
Asset allocation does not ensure a profit or protect against a loss.
A CDS contract is a derivative product that protects the CDS buyer from a credit default of the underlying security. Credit risk is transferred to the seller of the CDS contract, who requires a premium for the protection. As credit risk increases or decreases, the contract premium goes up and down, similar to an insurance policy.
A typical notional on a CDS is in the range $10-$20 mm. CDSs have a stated maturity (typical terms are 3, 5, 7, and 10 years), with the most liquid point at 5 years. Typically, credit default swaps are the domain of institutional investors.
Preferred stock dividends are paid at the discretion of the issuing company. Preferred stocks are subject to interest rate and credit risk. As interest rates rise, the price of the preferred falls (and vice versa). They may be subject to a call feature with changing interest rates or credit ratings.
The fast price swings in commodities will result in significant volatility in an investor’s holdings. Commodities include increased risks, such as political, economic, and currency instability, and may not be suitable for all investors.
Value investments can perform differently from the market as a whole. They can remain undervalued by the market for long periods of time.
The prices of small cap stocks are generally more volatile than large cap stocks.
International investing involves special risks such as currency fluctuation and political instability and may not be suitable for all investors. These risks are often heightened for investments in emerging markets.
For a list of descriptions of the indexes and economic terms referenced in this publication, please visit our website at lplresearch.com/definitions.
This research material has been prepared by LPL Financial LLC.
Securities and advisory services offered through LPL Financial (LPL), a registered inv estment advisor and broker -dealer (member FINRA/SIPC). Insurance products are offered through LPL or its licensed affiliates. To the extent you are receiving investment a dvice from a separately registered independent investment advisor that is not an LPL affiliate, please note LPL makes no representation with respect to such entity.
| Not Insured by FDIC/NCUA or Any Other Government Agency | Not Bank/Credit Union Guaranteed | Not Bank/Credit Union Deposits or Obligations | May Lose Value |
RES-1479306-0323 | For Public Use | Tracking #1-05368284 (Exp. 04/24)

