
Preferred Securities: Still Our Preferred Non-Core Bond Sector
It continues to be a challenging environment for a lot of fixed income markets, especially higher quality markets. With the Federal Reserve (Fed) seemingly unlikely to lower interest rates until after the summer months (at the earliest), the “higher for longer” narrative has kept a lid on any sort of bond market rally. And while falling interest rates help provide price appreciation in this higher-for-longer environment, fixed income investors are likely better served by focusing on income opportunities. That’s where preferreds come in. With yields still elevated relative to history, we think preferred securities are an attractive option for income-oriented investors.
An Intro Into the Preferred Securities Market
Preferred securities (preferreds) are often referred to as “hybrid” securities as they have both bond and equity characteristics. This hybrid nature results in preferred securities being senior to common stock but subordinated, or junior to bonds within a company’s capital stack. Similar to bonds, preferred securities offer a stated yield and a par value, which limits potential losses while not participating in potential price appreciation of a company’s common stock. While there are many types of preferred securities, dividends are generally guaranteed, but may be deferred based on company management’s discretion. Preferred securities, then, tend to offer a higher yield compared to other bonds issued by a company to attract investors.
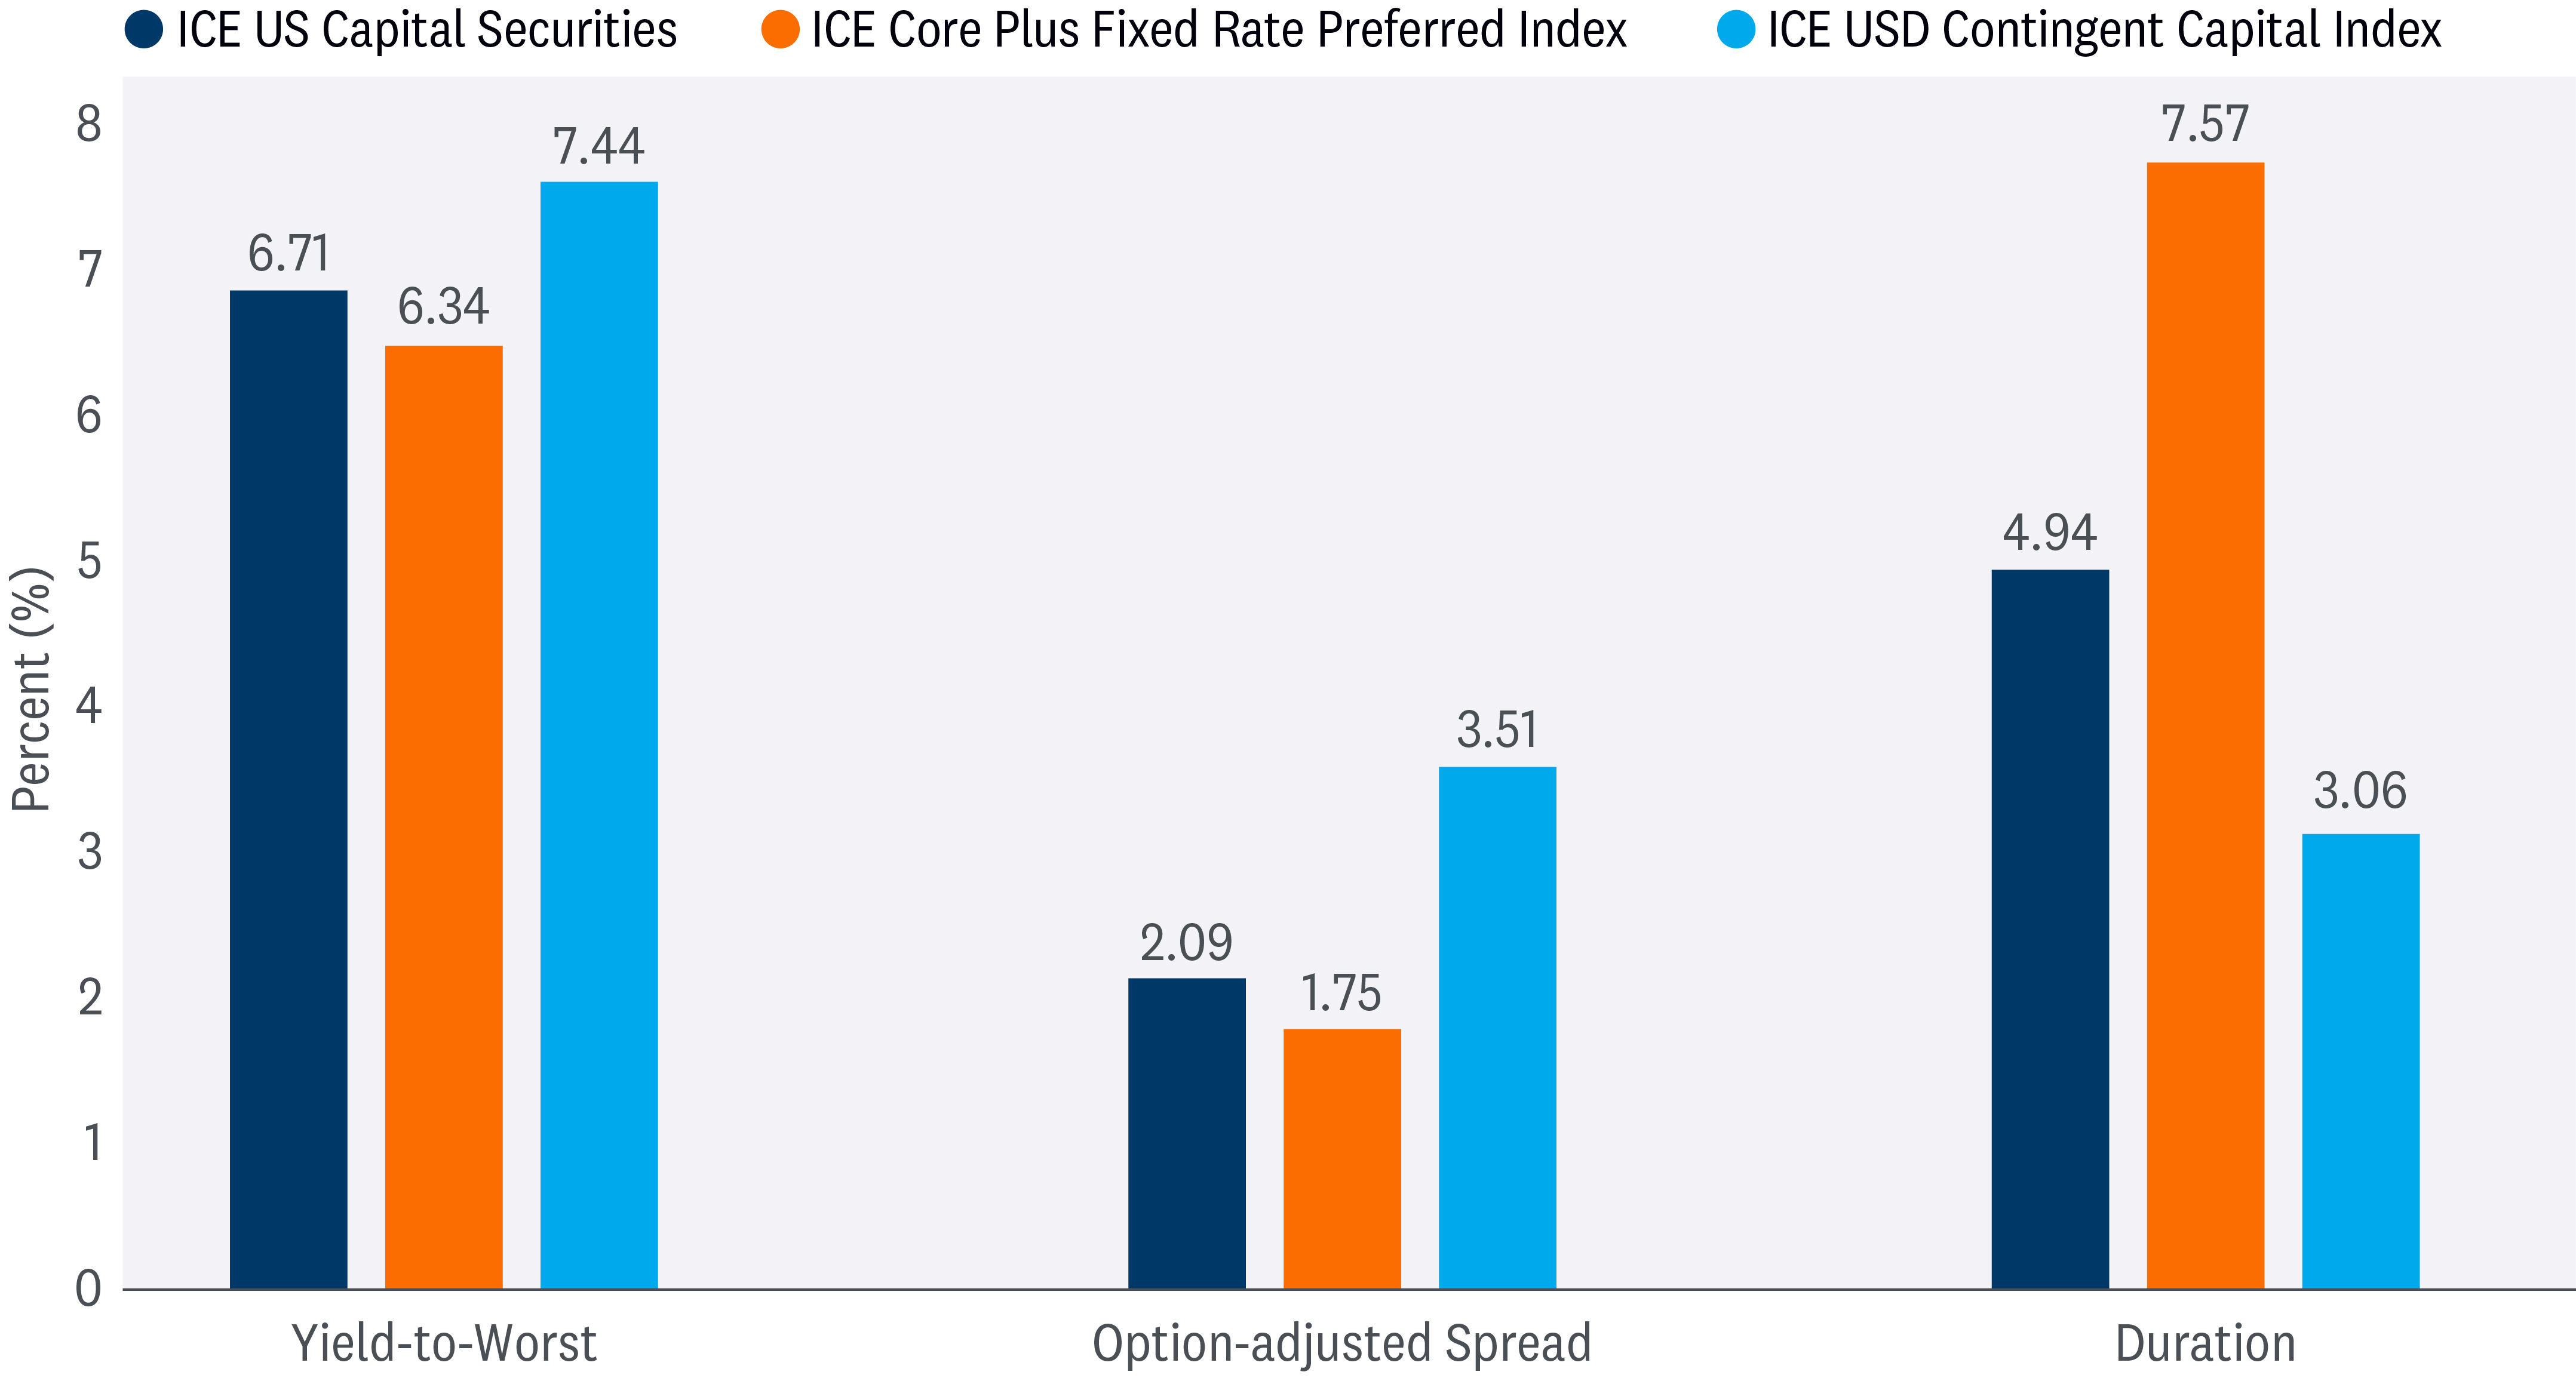
There are three primary segments of the preferred market — 1) retail (known as $25 par), 2) institutional (known as $1,000 par), and 3) Contingent Convertible (known as CoCo). In total, the preferred market is over $1 trillion, with the retail, institutional, and CoCo segments representing roughly 25%, 35%, and 40%, respectively, of the market. The retail market (ICE Core Plus Fixed Rate Index) is an exchange-traded market where the securities generally have longer durations and lower yields, whereas the institutional market (ICE US Capital Securities Index) is an over-the-counter-traded market where the securities pay dividends semi-annually. The CoCo market is primarily composed of European financial issuers (ICE USD Contingent Capital Index) with different characteristics and different risk premiums. CoCos came into existence following the Global Financial Crisis (GFC), with regulators creating CoCos as a means to provide an additional layer (known as Additional Tier 1 or AT1) of capital to absorb losses in the event of a bank default. It isn’t uncommon to have companies issue securities across the three markets.
Preferred Securities Trade in Multiple Markets and Have Different Characteristics in Each Market
Source: LPL Research, Bloomberg 05/07/24
All indexes are unmanaged and cannot be invested in directly.
Past performance is no guarantee of future results.
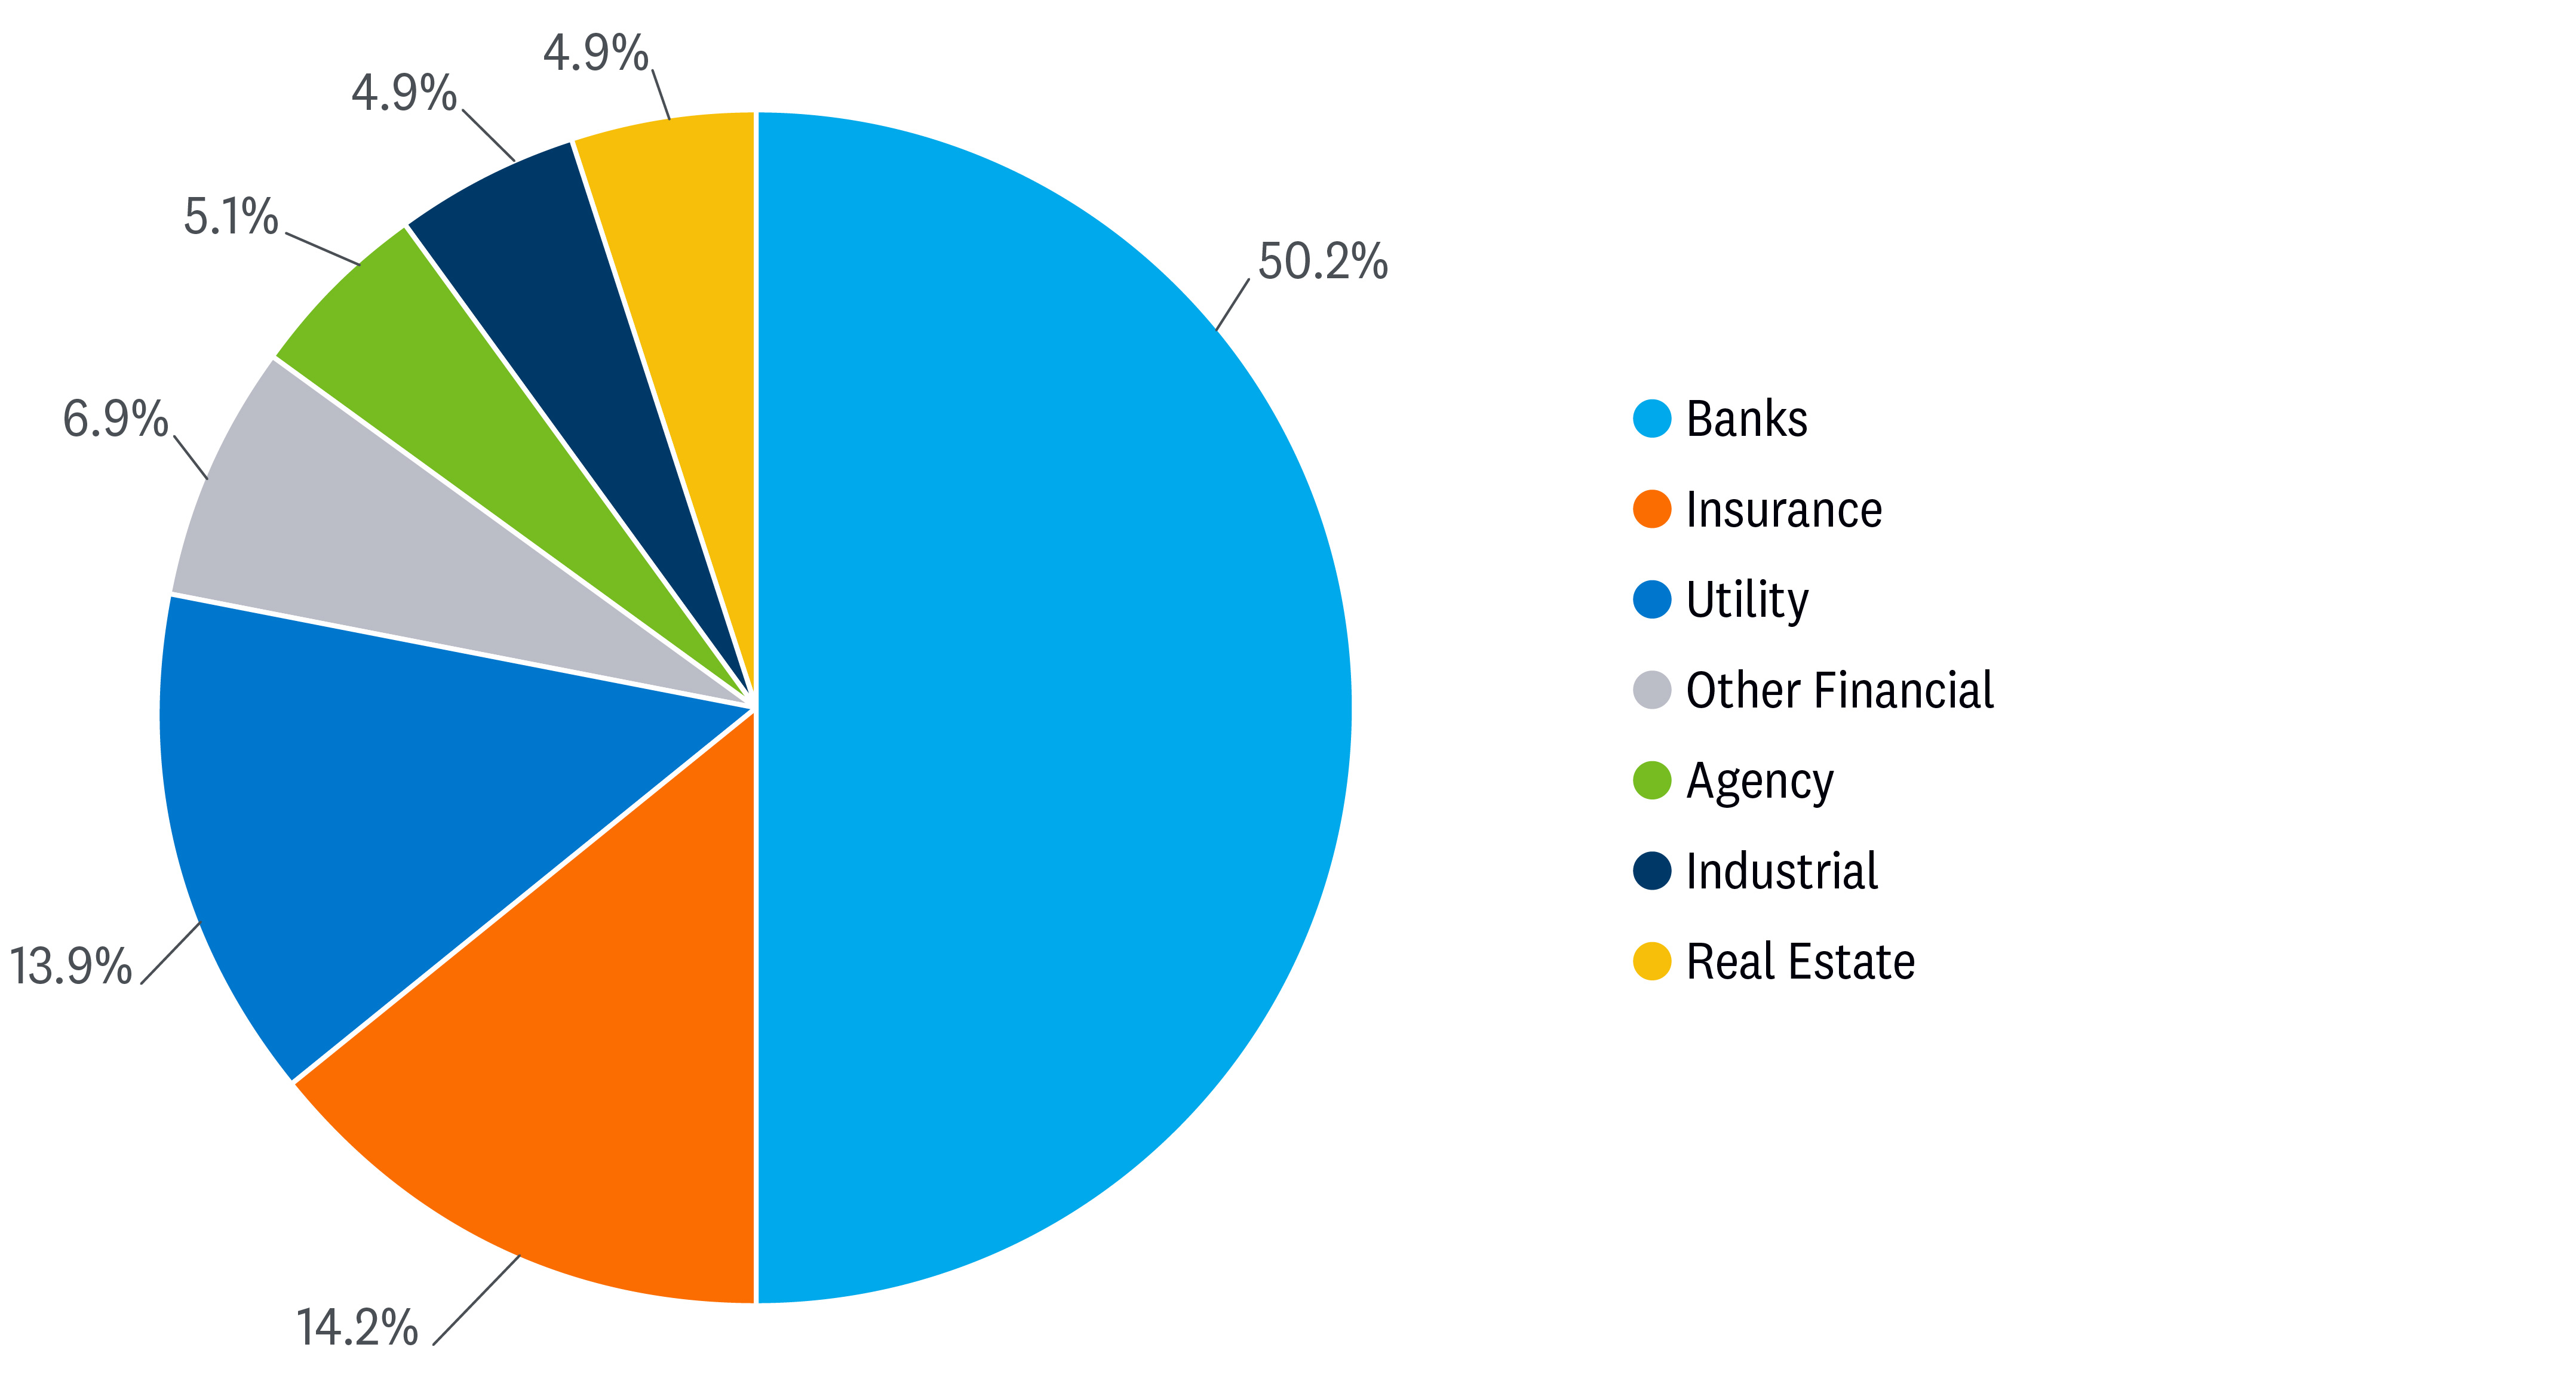
Preferreds are issued primarily by financial institutions, with the largest issuers being banks and insurance companies. Real estate investment trusts (REITs), utilities, and other financial institutions also issue preferreds. Preferred securities count toward regulatory capital requirements, so banks issue preferreds to help them maintain their required capital ratios. Preferred securities are highly correlated with the health of the financial system, and a shock to the financial system would adversely impact these securities. Preferreds tend to be BBB- or BB-rated, i.e., they carry higher levels of credit and default risks than senior debt issued by the same issuer. However, since the issuers of preferred securities tend to be higher quality companies and investment-grade rated, default rates have been lower than similarly rated non-financial corporate bonds.
Financial Institutions are the Largest Issuers of Preferreds
Source: LPL Research, Bloomberg 04/30/24
Why Invest in Preferreds
The LPL Research Strategic and Tactical Asset Allocation Committee (STAAC) maintains its positive view on preferreds given attractive valuations relative to history. Given the hybrid nature of preferred securities, there are diversification benefits to adding preferreds to a portfolio. While these securities tend to “act” like equity and high-yield fixed income securities across a full market cycle, since the financial crisis in 2009, these securities have generally held up better than both asset classes during equity market sell-offs (as measured by the S&P 500 Index). Additionally, preferred dividends are taxed at qualified dividend income rates, which may be less than ordinary income tax rates (top federal rate of 37%). This means that for U.S. investors, preferred stocks may provide a compelling after-tax yield relative to other asset classes.
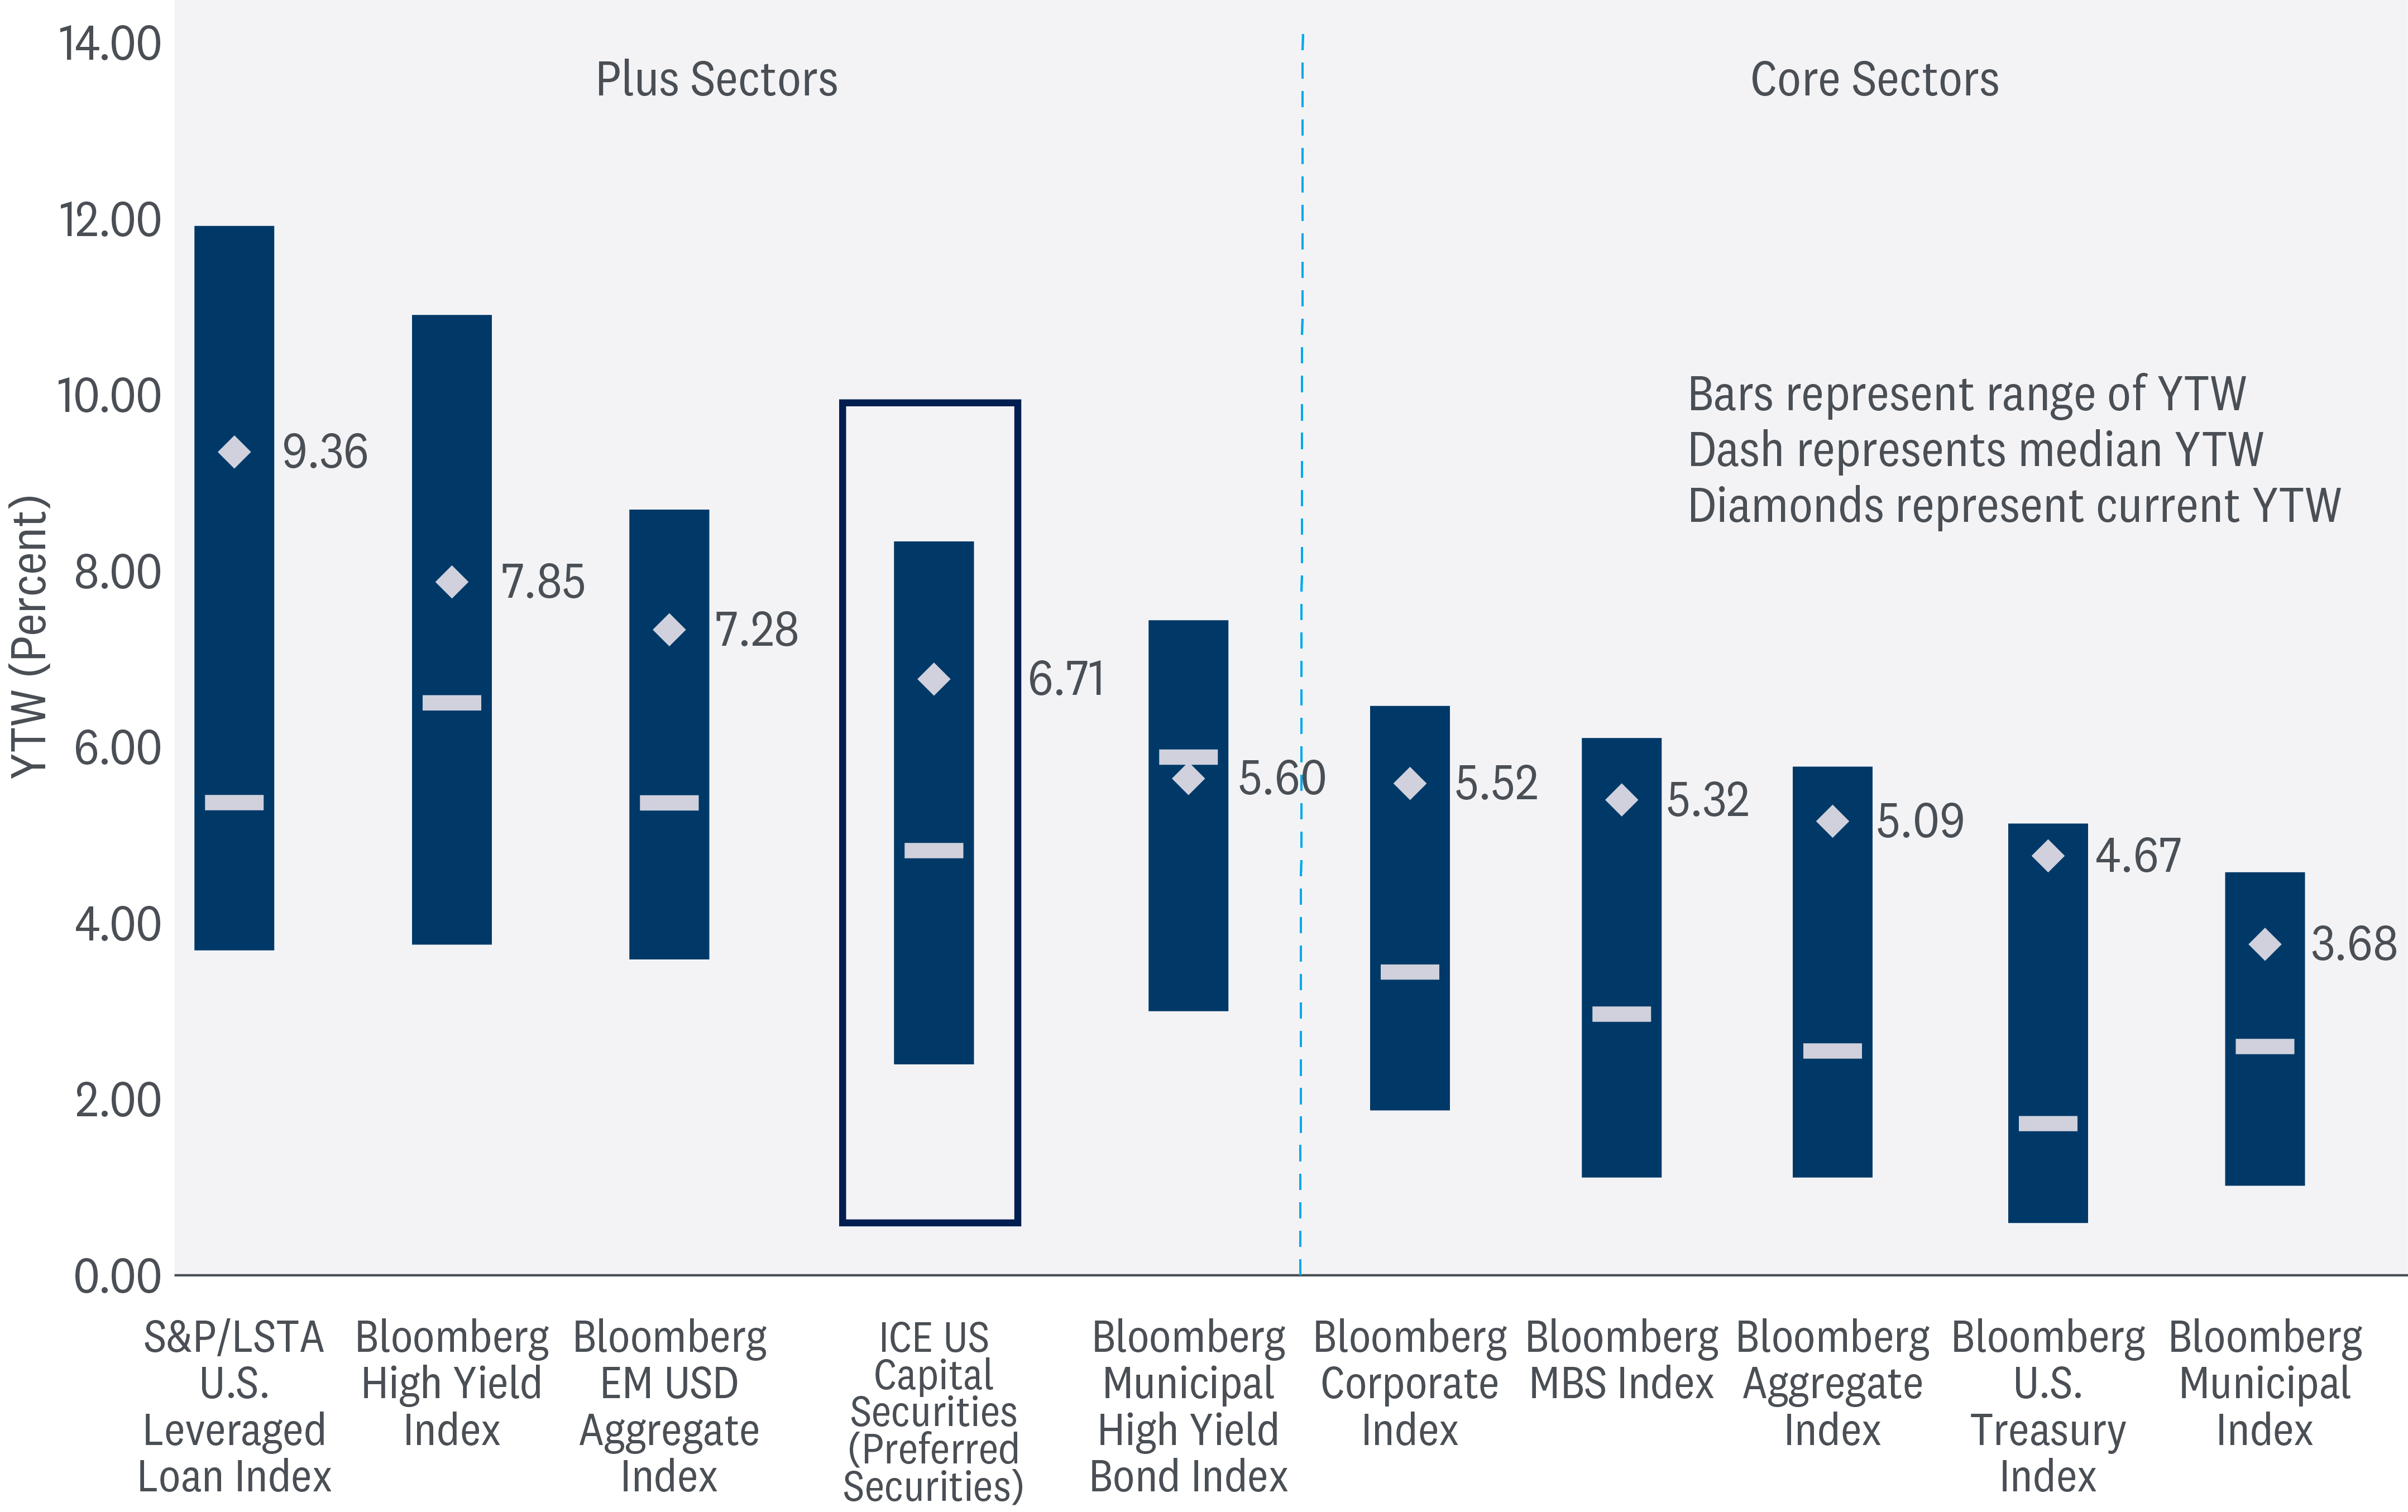
Preferred Securities Offering Yields Much Higher Than Historical Averages Yield-to-Worst (YTW) Across Fixed Income Sectors (%) Since 2010
Source: LPL Research, Bloomberg 05/07/24
All indexes are unmanaged and cannot be invested in directly.
Past performance is no guarantee of future results.
In general, preferreds offer generous yields, both absolute and after-tax, with their high income stream serving as a total return buffer against future spread volatility. As such, preferred securities can be higher-yielding alternatives to traditional core fixed income options. Moreover, index yields remain elevated relative to history, so these securities could be an attractive option for income-oriented investors.
Commercial Real Estate Worries and the Impact on Bank Preferreds
And while there is a lot to like about preferred securities, there will likely be financial institutions that could be negatively impacted by the ongoing challenges in the commercial real estate (CRE) market. The surge in interest rates and pullback in bank lending following last year’s regional banking crisis has led to substantial stress in the U.S. CRE market, particularly within the office sector.
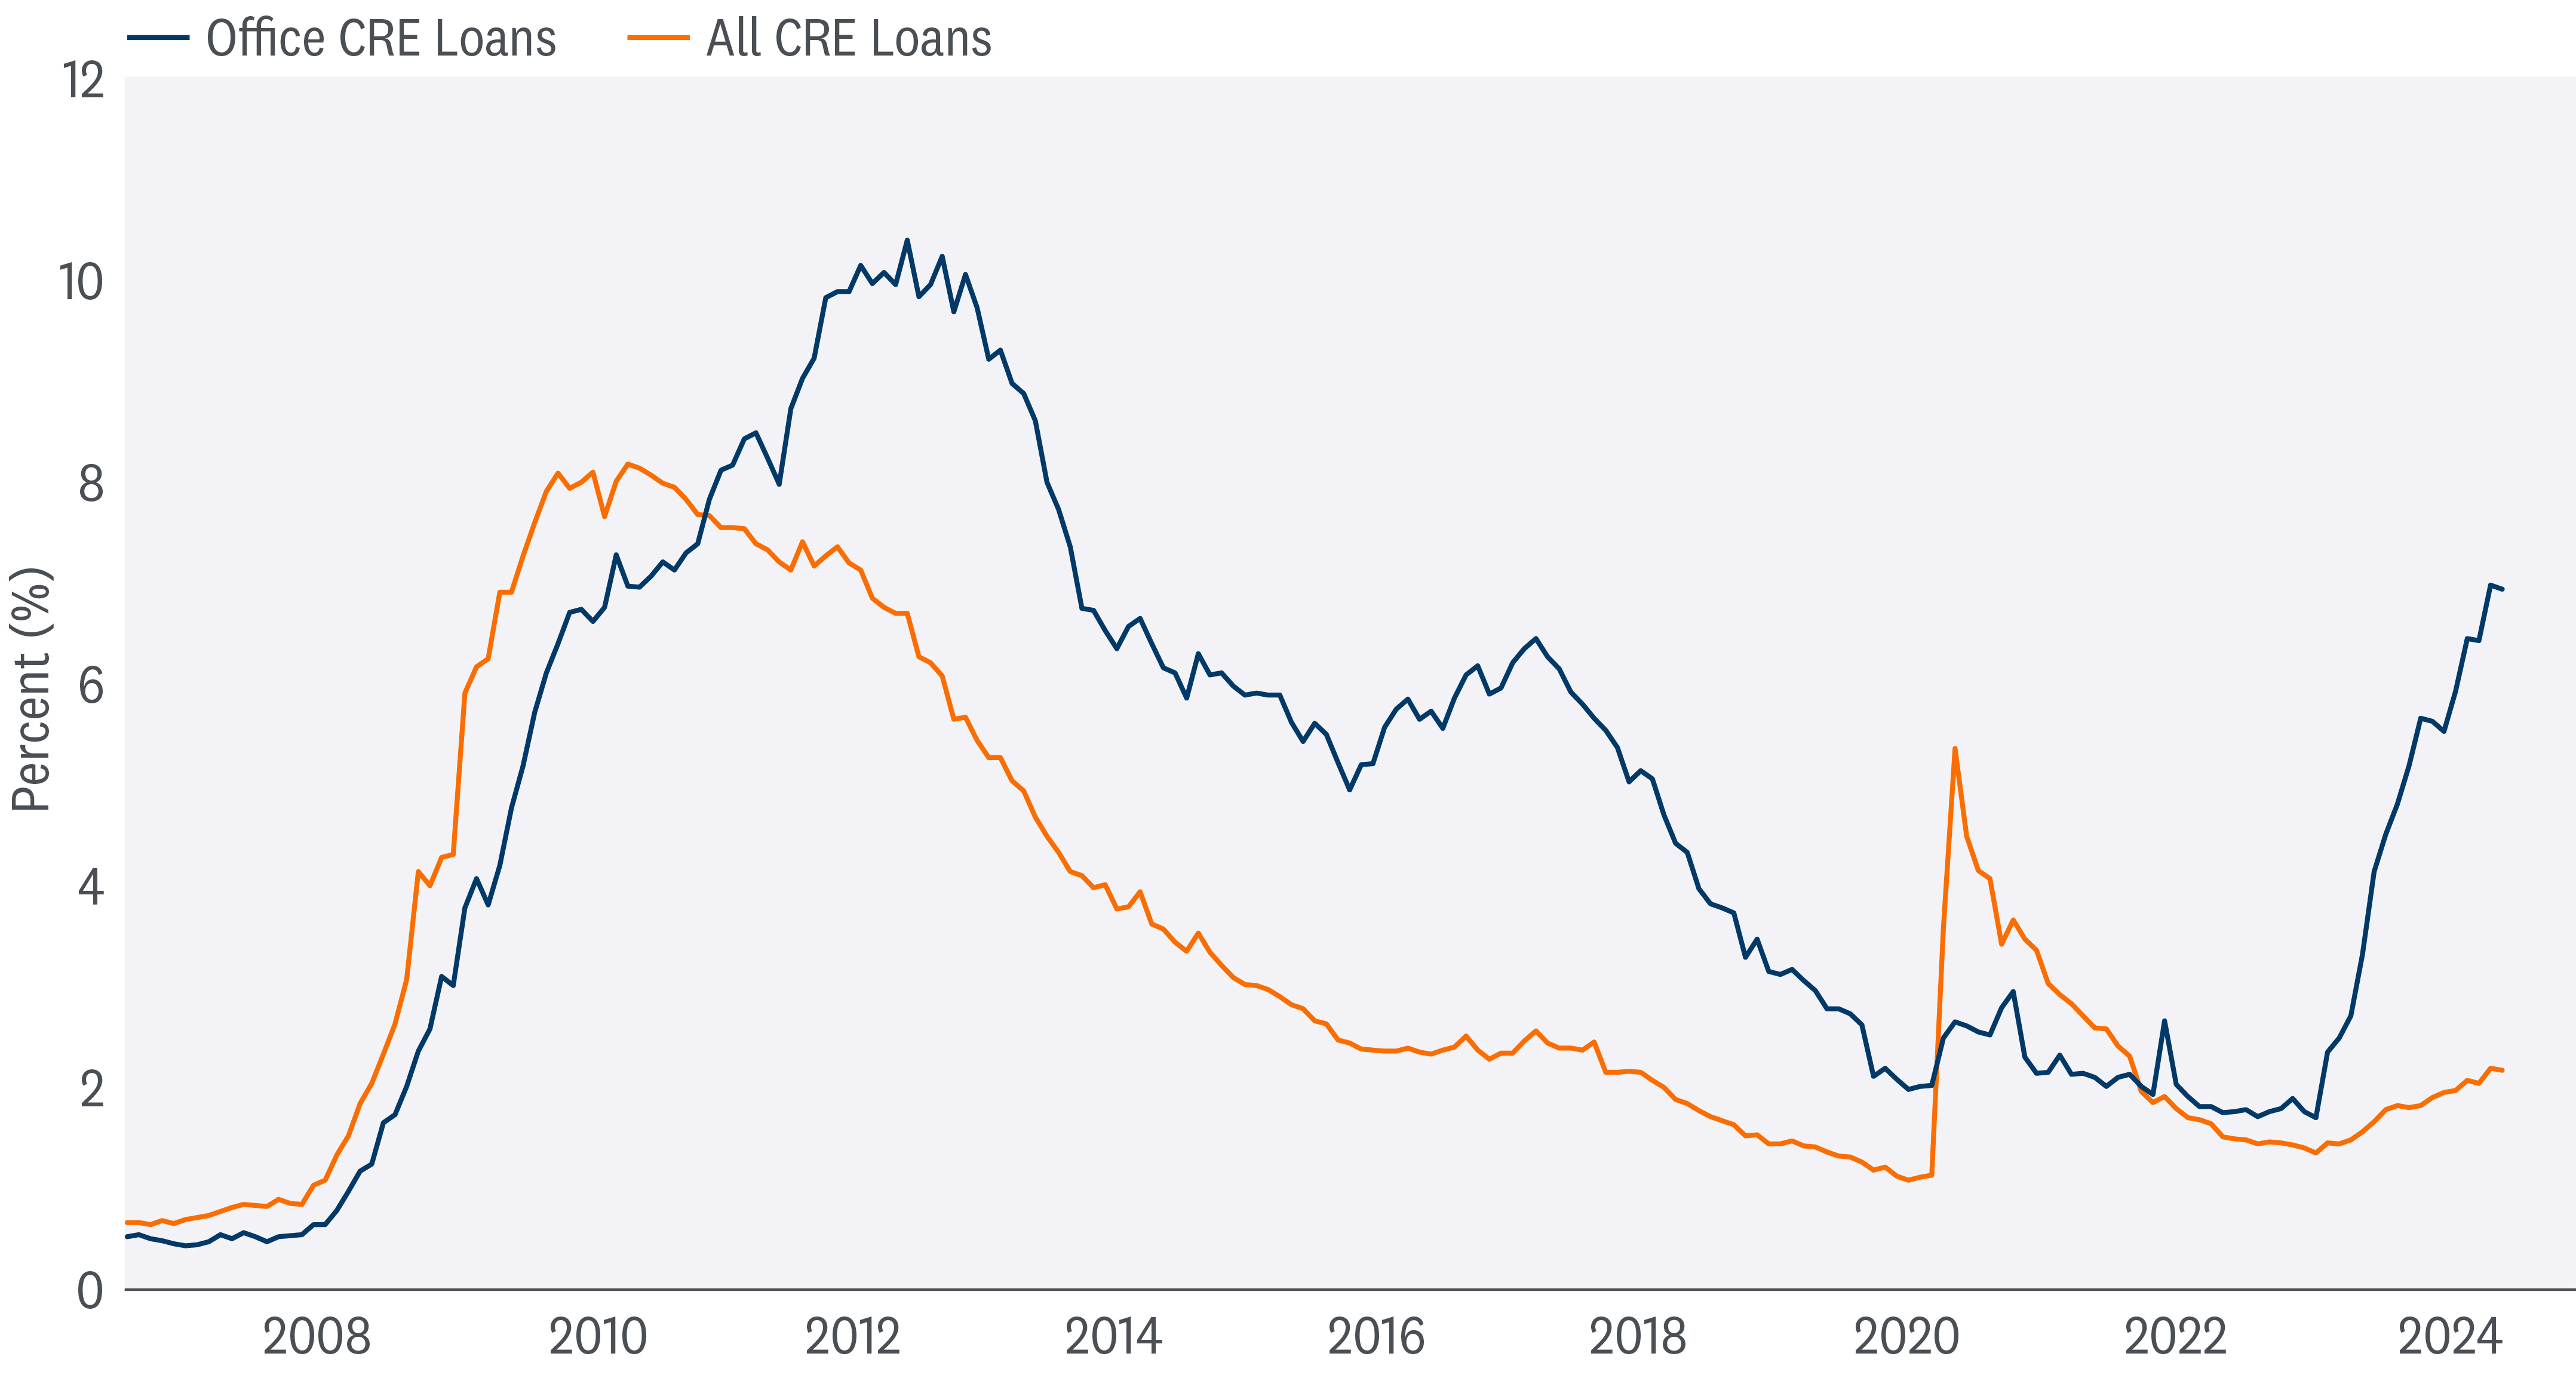
Borrowers in the U.S. CRE market continue to face elevated refinancing needs, with $1.2 trillion in loans maturing in the next two years. These needs add to existing challenges from shifting real estate utilization, higher funding costs, and shrinking credit availability. In practice, however, the debt market has so far weathered these challenges better than expected, for two key reasons. First, lenders have worked with borrowers to modify and extend maturing loans that might otherwise go down the path of foreclosure (a practice dubbed “extend and pretend”). Second, the pressure has largely been concentrated in office properties, with fewer signs of deterioration for other property types. Office sector delinquencies (30+ days late) have recently eclipsed 6%, while other CRE loan delinquencies remain muted. And with interest rates remaining elevated, it’s likely delinquencies could soon approach levels last seen during the GFC.
Office Commercial Real Estate (Cre) Delinquencies (30+ Days) Have Spiked
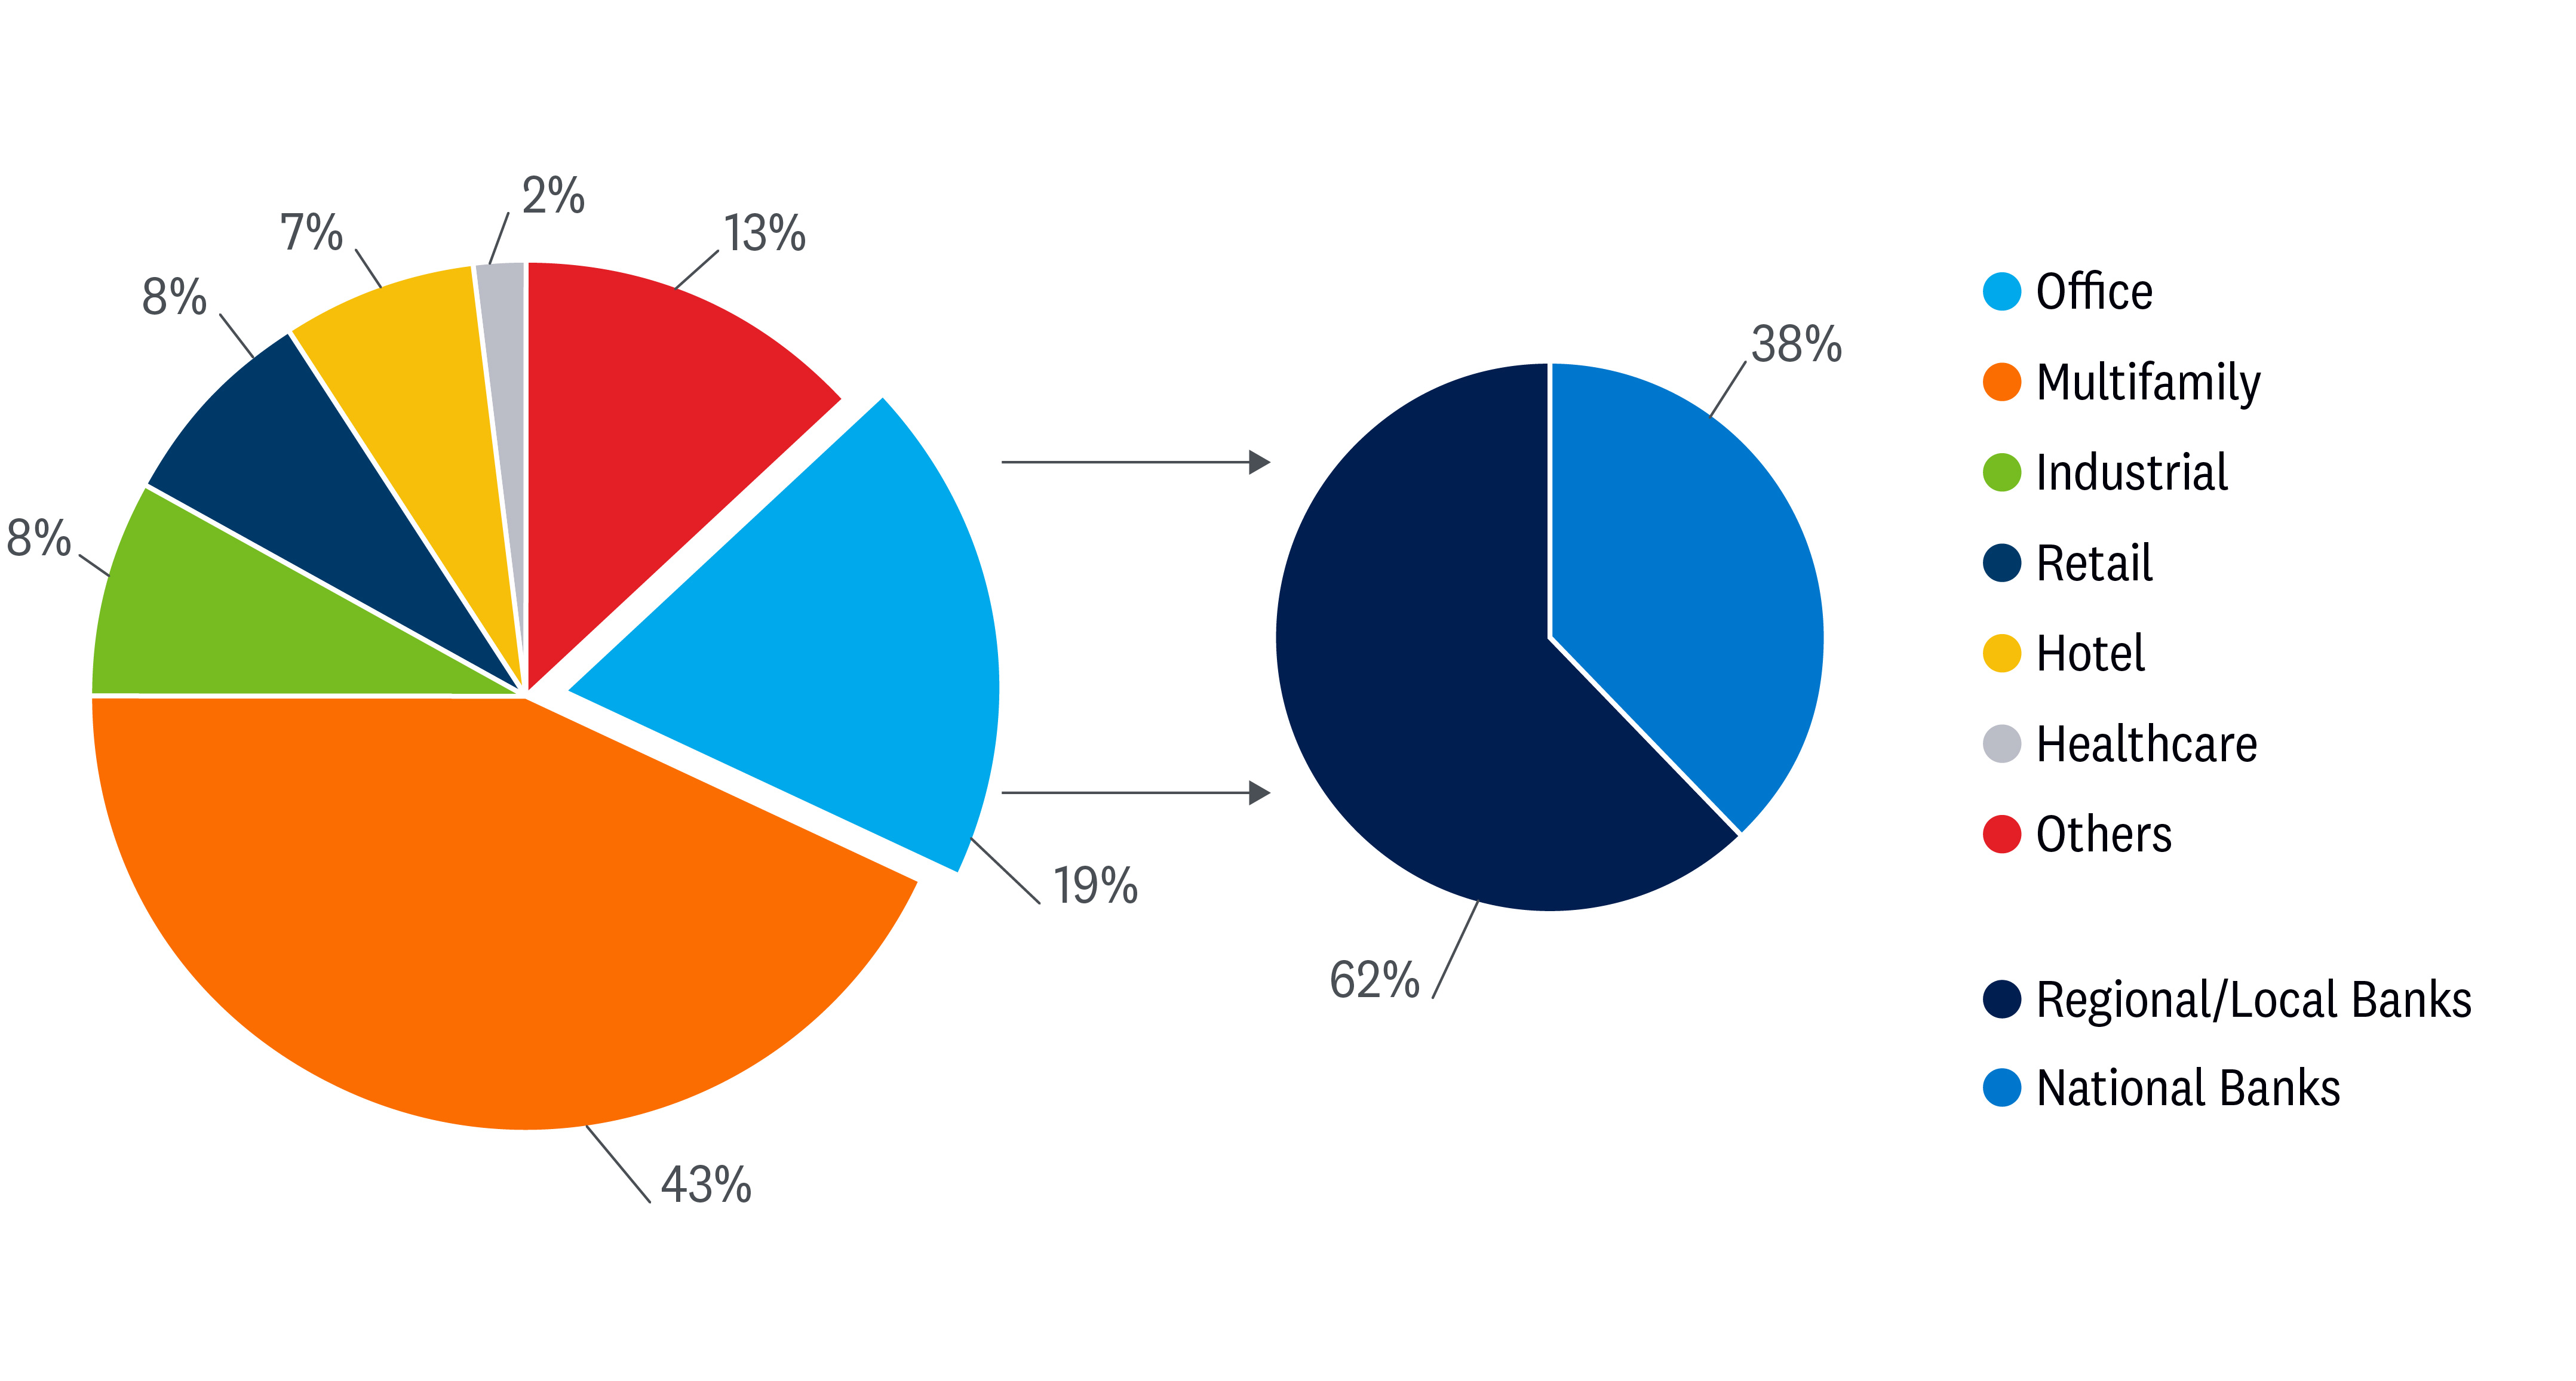
That said, and as mentioned above, it’s important not to paint a broad distressed-brush across all CRE sectors. The office sector only represents roughly 19% of total CRE loans and other sectors, such as malls and hotels, are performing fine. It’s the office sector that is the primary challenge for financial institutions, and even there, the financial institutions at elevated risk are the smaller and more regional banks that make up over 60% of lending to the office sector. As such, less than 40% of lending comes from national banks, which tend to make up the majority of preferred security issuance. Depending on the index, regional banks only make up a high single/low double-digit percentage of preferred security issuance.
Additionally, as a result of specific concerns regarding CRE risks, the Fed included a scenario in the 2023 annual bank stress test where CRE valuations dropped by 40%. The exercise showed that a large drop in CRE prices would likely only negatively impact a small fraction of total assets in the U.S. banking system. Banks with over $100 billion in assets (large banks) have relatively small exposures to CRE, relative to their assets, so the fall in CRE prices had a minimal impact on bank balance sheets, according to the report.
The Office Sector Makes Up 19% of Commercial Loans in the U.S. and Regional Banks Account For 62% of Office Lending
Source: LPL Research, Bloomberg 05/07/24
All indexes are unmanaged and cannot be invested in directly.
Past performance is no guarantee of future results.
Earlier this year, when asked about CRE issues, Fed Chair Jerome Powell acknowledged the stress within the CRE sector and the risk it poses for banks but said it is a “manageable” situation at this point. Powell added that the Fed has been talking to these regional and smaller banks for some time now. And said bluntly that there will likely be additional bank failures. However, he went on to emphasize that it is smaller and medium-size banks, rather than the big banks, that are at risk.
Conclusion
As noted above, preferreds are concentrated in the financial sector, but since the GFC, many financial institutions have emerged with stronger balance sheets, which should limit downgrades and defaults, in our opinion. Despite the challenging earnings environment for financials and bank stress from domestic regional banks, the fundamental health of the financial system remains intact. These financial institutions can likely weather any potential recessionary storm while continuing to pay dividends on their preferred securities. However, as noted, risks remain — particularly for smaller and more regional banks.
To fully understand the CRE challenges, LPL’s STAAC has regularly brought in outside experts to present to the Committee with the key takeaway that this is a problem that may take several years to play out. Moreover, in our view, the CRE challenges are largely idiosyncratic. And while delinquency rates in CRE loan books remain elevated, we do not think they pose a systemic risk to the banking system.
Despite these concerns, preferred securities, as proxied by the ICE BofA All Capital Securities Index, have outperformed many other plus (and core) sectors so far this year. While we still recommend the majority of fixed income exposure to be allocated to core bonds, for those income-oriented investors willing to take on some additional credit risk, preferred securities may be an attractive investment to consider.
And while there are a number of options available for investment, our preferred expression within the sector is through active management due to the different markets with different characteristics. Most active managers can take advantage of the relative value opportunities across markets (many issuers issue in all markets) whereas many ETFs (not all, though) tend to invest only in the more liquid retail market. Finally, given the ongoing challenges within the regional banking sector, active managers may be able to avoid the institutions most at risk from CRE issues (no guarantees, though).
Tactical Asset Allocation Insights
LPL’s STAAC maintains its neutral equities stance tactically. The improved economic and earnings outlook this year has kept the risk-reward trade-off for stocks and bonds fairly well balanced, perhaps with a slight edge to bonds over stocks currently when looking out to year-end. Recent stubbornly high inflation readings likely delayed Fed rate cuts and may limit the upside to stock prices over the balance of the year, although two cuts may still come by year-end.
Within equities, on a tactical basis, the STAAC continues to favor a tilt toward domestic over international equities, with a preference for Japan among developed markets, and an underweight position in emerging markets (EM).
The Committee recommends a very modest tilt toward the growth style after reducing its overweight position in mid-March. Higher-for-longer and steady economic growth favors value in the short term, but once the disinflationary trend resumes and rates calm down, look for growth to benefit from its superior earnings power. Communication services and energy remain favored sectors.
Finally, the STAAC continues to recommend a modest overweight to fixed income, funded from cash.
Lawrence Gillum, CFA, Chief Fixed Income Strategist
IMPORTANT DISCLOSURES
This material is for general information only and is not intended to provide specific advice or recommendations for any individual. There is no assurance that the views or strategies discussed are suitable for all investors or will yield positive outcomes. Investing involves risks including possible loss of principal. Any economic forecasts set forth may not develop as predicted and are subject to change.
References to markets, asset classes, and sectors are generally regarding the corresponding market index. Indexes are unmanaged statistical composites and cannot be invested into directly. Index performance is not indicative of the performance of any investment and do not reflect fees, expenses, or sales charges. All performance referenced is historical and is no guarantee of future results.
Any company names noted herein are for educational purposes only and not an indication of trading intent or a solicitation of their products or services. LPL Financial doesn’t provide research on individual equities.
All information is believed to be from reliable sources; however, LPL Financial makes no representation as to its completeness or accuracy.
US Treasuries may be considered “safe haven” investments but do carry some degree of risk including interest rate, credit, and market risk. Bonds are subject to market and interest rate risk if sold prior to maturity. Bond values will decline as interest rates rise and bonds are subject to availability and change in price.
The Standard & Poor’s 500 Index (S&P500) is a capitalization-weighted index of 500 stocks designed to measure performance of the broad domestic economy through changes in the aggregate market value of 500 stocks representing all major industries.
Preferred stock dividends are paid at the discretion of the issuing company. Preferred stocks are subject to interest rate and credit risk. As interest rates rise, the price of the preferred falls (and vice versa). They may be subject to a call feature with changing interest rates or credit ratings. Bonds are subject to market and interest rate risk if sold prior to maturity. Bond values will decline as interest rates rise and bonds are subject to availability and change in price.
All index data from FactSet.
International investing involves special risks such as currency fluctuation and political instability and may not be suitable for all investors. These risks are often heightened for investments in emerging markets.
LPL Financial does not provide investment banking services and does not engage in initial public offerings or merger and acquisition activities.
This research material has been prepared by LPL Financial LLC.
Securities and advisory services offered through LPL Financial (LPL), a registered inv estment advisor and broker -dealer (member FINRA/SIPC). Insurance products are offered through LPL or its licensed affiliates. To the extent you are receiving investment a dvice from a separately registered independent investment advisor that is not an LPL affiliate, please note LPL makes no representation with respect to such entity.
| Not Insured by FDIC/NCUA or Any Other Government Agency | Not Bank/Credit Union Guaranteed | Not Bank/Credit Union Deposits or Obligations | May Lose Value |
RES 0001182-0424 | For Public Use | Tracking #577175 (Exp. 05/2025)

